Monthly Archives: January 2013
It surprises me that so many folk who analyse and comment on what is happening in China’s aluminium industry keep making the same mistake year after year.
The “official” production data, whether you take it from the National Bureau of Statistics or from China’s Nonferrous Industry Association, is quite simply wrong. w-r-o-n-g. It should come as no surprise, as most other data published by the bureaucracy in China is also wrong.
The NBS has said that China produced 19.8 million tonnes in 2012. And that is the number you see in many trade publications, analysts’ reports and so on. But officials in Beijing refuse to recognise any production which comes from plants which do not enjoy endorsement from their counterparts in other ministries. Take the Wei Qiao group of smelters in Shandong province. They have upward of 2 million tonnes of capacity between them. But they were built without NDRC approval. Hence output from these plants is not included in the official number. It is the same with some other smaller plants, though none come close to the size of Wei Qiao.
It has got to the point that the CNIA’s publishing arm even publishes an adjusted number, with a footnote that they have allowed for some smelters that don’t report to the authorities.
Here at AZ China, we are still compiling all the production data from all of China’s 130 something smelters. But on a first pass calculation, we reckon the real number should be in the vicinity of 21.5 million tonnes. Certainly the alumina market supply/demand balance suggests something higher than what the NBS says. And the amount of hidden inventory also supports a higher number.
We will be publishing our final figures to our private clients, so if you aren’t already a client, be sure to sign up with us. And if you are an analyst or commentator, go back and re-check what happened with China’s aluminium production figures last year, and the year before that…
(Hint, they were short by up to 2 million tonnes each year.)
The recent write downs at the Australian commodity producers/exporters may seem like an unfamiliar sight for the market, but behind it may lay economic forces that made this occurrence inevitable. What we are witnessing here may just be a part of the unwinding of the supercycle. A reversal of fortune from the buildup in capital and investment over a long period of time, intertwined with the reaching of the tipping point in our last credit cycle, the rise of emerging economies, and the resultant commodity booms; lastly, a great recession that turns it around.
A reversal of fortune
Australian commodity producers are now very much viewed as a sector that spent too ambitiously, lacking in capital discipline. In the context of time, the expansion plans did not seem all that outrageous a few years ago. That of course was near the end of the long-run credit cycle. So it follows, the credit cycle ended with the FED out of ammunition; debt, particularly household debt and government debt reached their upper limits, which leads to deleveraging. Europe witnessed predominately a turning point in sovereign debt.
The rise of emerging Asia, particularly China, as a major global manufacturing base, meant advanced economies would struggle to compete, due to factors such as structurally low cost of labor in Asia. As a result, advanced economies forged ahead in consumption and services such as finance and business services. However, growth was powered by credit expansion; this money recycled back into the banking and capital markets, generating bubbles in the various asset classes over decades. Interest rates started to head down since the 70’s, gradually and surely, retreating towards zero. Now, advanced economies cannot rely on leverage anymore, so organic growth is favored. Debt has meant monetization; the role of the USD starts to dwindle as it depreciated. Hopes are building for a ‘3rd industrialization’ that could generate new industries to power growth.
What this means for emerging economies is that the illusion of export has ended; this was clearly seen in China in the last 5 years. China has historically run a current account surplus, exporting the excess from its own domestic capital formation to advanced economies, but that has ended. A double whammy for China, as its current growth model is inadequate for sustainable high growth; it has reached the end of its rope, and it must slow down. Now, China seeks private consumption expansion, service sector growth and its own credit market growth.
We finally turn to the very front of the global supply chain, the commodity producers. Because of the slowdown in the emerging market manufacturers, who are now constrained by the West which has reached the end of its credit cycle; and because the growth model in these countries needs to change to become a more domestically orientated one, a slowdown in commodity demand has become apparent. However, the credit policies of countries such as Australia have been prudent; credit expansion in the mining sector has been tempered. Now, the equity market is all punishing the sector for its inability to foresee it all coming.
What will they do?
We are likely faced with a period of lower demand as commodity importers adjust their models over time. Rebalancing will mean the FED continues to choose inflation, money supply and a weaker dollar. In any case, no particularly strong growth will come out of advanced economies as they struggle to deleverage, and that will take between 10 to 20 years. Commodity exporters will have to wait until either inflation, growth or both to come back. Before then, there is little reason for them to outperform.
China’s National Bureau of Statistics (NBS) last week published the “Gini Co-efficient” index. This was something of a first for China. Let’s look at what it means, especially for China.
What does Gini Index mean?
In economic term, the Gini Index is normally used to measure the inequality of income or wealth. The Gini Index has a range of 0-1, in which zero represents perfect equality, so the higher Gini Index indicates larger income gap. The Gini Index of developed countries is normally at the range of 0.24 to 0.36, except the USA, which is at 0.4. But it is not necessarily good to be low as possible; the ratio below 0.2 indicates the country is lacking the energy to develop further. And a ratio above 0.4 indicates there should be some issues with social mechanisms and potential unrest.
How about China Gini index?
NBS published China Gini Index 2003-2012, in which 2012 Gini Index was 0.474. It was the 2nd time China’s government has published the official Gini Index. The first official publication was in 2000. What does the Chinese government mean to achieve, to publish the Gini Index after 10 years, especially since the data indicates China’s inequality of income and wealth?
We believe the new administration and new leaders are undertaking to increase transparency of government information and are willing to face the challenges of social mechanisms’ reform.
| Year | Gini Index |
| 2003 | 0.479 |
| 2004 | 0.473 |
| 2005 | 0.485 |
| 2006 | 0.487 |
| 2007 | 0.484 |
| 2008 | 0.491 |
| 2009 | 0.490 |
| 2010 | 0.481 |
| 2011 | 0.477 |
| 2012 | 0.474 |
| (Source:NBS) |
What does inequality mean?
The Gini index as an economic measurement represents inequality of income and wealth, which refers to social resource distribution. If we compared the ratio with other developed or developing countries, we could find the obvious phenomenon that developing countries kept a higher Gini Index when moving to a higher GDP. For example the Gini index of Malaysia in 1996 was 0.49, when the GDP was 7.3%. Many examples show it is a normal phenomenon that countries maintain a higher Gini index while on the path of development.
What does result in China inequality? When administrative power dominates social resource allocation, it will negative effect industry development and productivity, finally leading to industrial overcapacity and lower labor incomes. The government encourages industry development by publishing accommodative policies or suggestions; more capital investment enters these industries because of expected higher returns. However, these concentrated investments lead to overcapacity in some industries. If exports and the domestic market cannot consume the increased volume and inventory, the product price reduces to breakeven point and beyond, finally impacting real employment. This phenomenon has happened in several industries in China, such as the aluminium industry, solar industry and so on.
The Gini Indexes of developed countries were almost higher than 0.4 after primary social resource allocation, some of them were almost higher than0.5, like Britain and Italy in 2010 reached 0.51 and 0.53 separately. However, their Gini Index adjusted down to 0.34 after secondary allocation. Can China copy what they did? To a certain degree, we could apply and practise in the way. In the short term, they developed and perfected social security system in order to balance social resources. In the long run, they invested more into the public sector, especially in the education field. In the data shown in other investigative reports of China’s Gini Index, the education level contributed to Gini Index at 13% in 2010, and Gini Index of high educated group was smaller than low educated group.
What is next for China and the Gini Index?
China new administration and leaders decided to published the Gini data, making it a clear signal that they will work for reform on social resource reallocation. The danger will be that the index fails to move as much as some would like to see.
The Australian Press has been watching carefully the dialogue between Rio Tinto’s Pacific Aluminium and the Northern Territory and Australian Governments, over the supply of natural gas to the Gove alumina refinery.
The refinery is about as remote as you can get in Australia, in the far north east of the Northern Territory. It is easily one of the biggest employers in that State, and is a key piece of the asset portfolio in Rio’s divestment vehicle. Without alumina in the mix, the smelting assets drop even further in value, as they would have to buy at market prices.
The problem is that Gove runs on fuel oil, as at the time it was built, natural gas wasn’t available. With fuel oil prices so high, Gove can’t operate below about $400/t, so it needs a very high alumina price just to break even.
There has been talk for some time now about building a pipeline and bringing natural gas into the refinery. From an operating cost point of view, this would be a saviour for the plant, but the problem is, who will stump up the almost $1 billion needed to build the pipeline? And if Gove sucked so much gas out of the State system, would there be enough left for all the other users?
Naturally, the NT Government is very keen to keep Gove running, but doesn’t have that sort of money. They are looking to the Australian federal government to come to the table with their cheque book. Meantime, the NT Government is trying to figure out if they will have enough gas to supply the total market starting in 2015.
All this takes time, which is one thing that, on the face of it, Gove doesn’t have. Pac Al has said that they will make a strategic decision on the future of the plant following a review of options which will be concluded by the end of January. The Government has said they need until September to complete their study.
It’s a delicate balance, with many possibilities open to both sides. Pac Al has a new boss at the head of RT in Sam Walsh, who is quite familiar with the equation, but who also has maybe only 3 years in the job. He will be all about strategy execution, and is likely to take a tough stance. But closing Gove would not only cost hundreds of jobs, it would also water down the value of the other assets in the Pac Al portfolio. Perhaps Mr Walsh will decide that the net $25 billion that RT has already written off will cover the loss of this asset.
At the State level, the NT government has little if any wriggle room. It cannot allow the loss of jobs now or in the future. And it cannot take an inflationary approach to future gas supply. It faces being nothing but a pawn in this game.
Perhaps the most important part of the puzzle lies at the Australian Federal level. The Australian Government has already shown support for the local aluminium industry by supporting Point Henry smelter, although the amount there was far smaller. And 2013 is an election year in Australia - so perhaps once we get into election mode down under, a little pork barrelling might be evidenced. But that is still months away, and in the meantime, Gove continues to run at a loss.
The irony is, if Gove closed, alumina supply would be considerably shorter in the region, meaning prices would rise. Gove’s competitors would gain at Gove’s expense.
In my previous post, I talked about the causes of excess capacity. Especially in a planned economy, it is an all too familiar story.
Now, Beijing has announced a plan to consolidate some industries, including the primary aluminium sector, as a way to combat excess capacity. Let’s look into this some more.
Policy background
The policy context is now more favorable for industry consolidation in China than a few years ago. Policy response to the current downturn is likely to be a tempered one, with moderate levels of credit and liquidity expansions, and moderate fiscal injections. These coupled with demand side curbs such as in construction will generate an inflation environment that is also moderate, meaning commodity prices will not be supported by high growth nor will production expansion be motivated by excessive credit growth and price growth.
How to consolidate
Consolidation is likely to come in the form of M&A activities. Targets will likely be financially inefficient, non-SOEs. New requirements on output efficiency, technology level and financial performance will likely be assertive, putting pressure on companies with poor records in these areas. The government’s apparent stance on the matter is also a signal that subsidies will slowly fade out, as the market goes through an orderly period of consolidation. M&A activities over the next 3-4 years will potentially rise as a result.
One only has to look at what Beijing did in the coal industry. Quite apart from the awful safety record, China’s coal mining industry was riddled with inefficiency, causing coal shortages, imports and high costs. For the last several years, companies have been consolidated ruthlessly. The methods and some outcomes on a personal scale were almost criminal, but the result has been a remarkable turnaround in China’s coal situation.
High costs
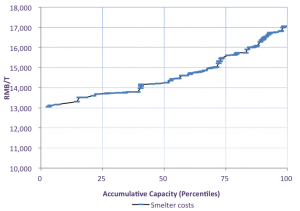
Having understood that financial assessment is appropriate here; cash costs of smelters can be used as a benchmark for assessing the likely profitability of smelters. Current metal price is not supporting the 4th quartile smelters in China; even the top end of the 3rd quartile is now underwater. We expect spot price to get to around 15,800RMB/t by the end of the year. Longer term contracts will trade higher as normal/contango market remains throughout the year. The actively traded 3M contracts will trade slightly higher than the spot at around 16,100RMB/t. This will mean that around 20 smelters will be still underwater by 2014 if the price predictions are right. These 20-odd smelters are located in various provinces, however, they tend to be concentrated in high cost provinces such as Henan. There is no doubt that the non-SOEs in the high-cost group will be the targets of consolidation. There are also smelters with old technologies; however, this group tends to be small.
SOEs are strong enough financially
State-owned enterprises such as Chalco and CPIC will not likely be the targets of M&A activities; however, they will be the acquirers of assets. There are about 5 state-owned high-cost smelters in China; while they put a dent in the cash flow statements of SOEs, SOEs are hardly affected in terms of financial stability. In actuality, SOEs are best suited as the government’s asset buyer in times of consolidation.
The economics of this is that when excess capacity reaches its tipping point, like asset bubbles, the now cheap and sometimes deeply indebted equities and underlying assets can 1) become default, causing shocks to the real economy, which may have further deflationary effects; or 2) they can be moved to the balance of the government, if the government’s capital structure still supports such moves. The second option of government takeover can smooth out the closing of capacities, redistribution of employment and achieve smoother price moves in the general market.
Another reason for government takeover would be the credit lines that SOEs enjoy. Government-initiated takeovers are likely to be backed and financed by the stated-owned commercial banks; so it becomes a concerted move to extend credit to SOE producers who would takeover private assets. All of these can be inflationary; prices can adjust back up as excess capacities leave the scene.
The upstream
Upstream raw material producers will see less demand as a result of consolidations in their downstream market, because less production will require fewer raw materials. On the surface, consolidation will seem to put downward pressure on raw material prices, yet raw materials such as alumina would eventually benefit from a rise in aluminium price, because its contracts are closely tied to the price of aluminium, despite the recent introduction of index pricing. The bargaining power of carbon and ALF3 producers will also increase. History shows, raw material prices are positively correlated to aluminium prices.
However, consolidation in the downstream will invariably mean that fewer commodities are needed, demand drops, price falls and then supply drops to match demand, price rises again. So, we are likely to see some adjustments in the raw material sectors along the way as well. However, one has to bear in mind that the process will likely be a smooth and gradual one, as the government will cushion any shock to the system, without risking sharp deflationary swings. This means the adjustments needed in the raw material sectors will likely move in sync with the downstream aluminium market.
Do we believe that Beijing will be successful in implementing this consolidation strategy? It is probably a matter of when not if. The typical pattern in Chinese bureaucracy is for a series of announcements, each successively ignored, until finally some action is taken. In the case of the coal industry consolidation, the first calls went out as early as 10 years ago, but the real momentum wasn’t achieved until 5-6 years later. In the case of China’s banning of Soderberg technology within the primary aluminium industry, the first regulation was promulgated in 1999, but it took until 2004 for real action to crank up.
Can China’s aluminium industry remain in over-supply for an extended period, until enough consolidation has taken place? Yes, but for all the wrong reasons. Something like 30 smelters are now enjoying subsidies. Banks continue to provide loans to companies with no prospect of repayment. New low-cost smelters continue to enter the market.
Excess capacity, in another words, The Great Leap
The MIIT (Ministry of Industry and Information Technology) has announced that it will reveal specific requirements to consolidate sectors that are subject to excess capacity. These sectors include automaking, steel, cement, shipbuilding, electrolytic aluminium, rare earth, electronic information and pharmaceuticals. Excess capacity is too familiar a concept for China, China’s first such experience in over-investment and excess capacity was in the heavy industries dating back to The Great Leap Forward of Chairman Mao’s era in the 1950’s, and which eventually led to a famine that killed millions of Chinese.
Economic activities were directed at forging China’s own commodity production capacities. Eventually it led to excess capacity, failures, wastage and an array of serious social problems. Since then, China has been acutely aware of the problem of excess capacity. The 11th Five Year Plan implemented capacity clearing and consolidation measures, but produced an ineffective end result, as many closed or merged firms were replaced by new capacities that sprung up their shadow.
The road to capacity building
The flag of ‘consolidation’ is by all means a reasonable and appropriate one; China’s secondary industries cannot continue to operate with capacity levels that are in some industries up to 2 times greater than demand. However, the idea of excess capacity begs for more clarification, and we ask questions such as why did the previous capacity clean-ups fail? Will it work this time and how should China approach it this time?
The phenomenon of excess capacity in industries is principally identical to asset bubbles; the perception of greater return sucks in more investment until it reaches an overvalued tipping point. One obvious point here is that supply comes online firstly as investments, investments that perceive greater future returns. Greater returns is a monetary concept, it is essentially the inflation of commodity assets (which also feeds into final inflation) that are driving investments.
For commodity producers, greater inflation entices them to make investments to increase supply, unless there is an obvious lack in demand, and that is rare. Overtime and eventually, an imbalance between demand and supply arises which is the excess capacity situation. It is at this point, or the point we are at now, that structural reform, policy response and market adjustments need to take place.
The end result is usually a downturn in price during a crisis. However, prolonged periods of deflation, stagflation and inflation are all possible, largely depending on the type of policy response. At this point, policy responses become key to determine future inflation. Two main factors need to be considered here, one is growth, which can be up, down or moderate; and the other is inflation, it can be up, down or moderate. A high inflation case may lead to more capacity building, which makes excess capacity worse; the other case is low inflation which leads to possible clearing of excess capacity.
Price stability or stock clearing
Modern central banks are mandated to target inflation and in some cases growth as well. It means a environment of price stability is preferred by central banks. The tools that are available include monetary policy, credit policy, fiscal policy and administrative policy. These policies can improve or worsen our economic reality. Invariably, monetary tightening encourages risk aversion and monetary loosening encourages inflation.
The previous capacity consolidation was cut-short by the GFC, when credit expansion and monetary loosening came into effect. Fiscal stimulus was another shot to expand liquidity in the system. These translated into fixed asset investments, which became both inflation and supply side expansions.
The current situation
China is better positioned now to clear excess capacity than 4-5 years ago, because it has adopted a policy of moderate monetary loosening, moderate inflation and moderate fiscal stimulus. These, coupled with controls on the property sector, credit growth and loan supplies, mean inflation along with commodity prices will not see a huge bubbly rally anymore. Less incentive is given to the investment side; this coupled with constraints on final demand is setting the stage for ‘consolidation’, which we expect to be more effective than last time.
There are unconfirmed reports that Century Aluminum is poised to buy the Sebree smelter from Rio Tinto Alcan.
Century, which is part-owned by Glencore, is said to be close to completing the deal. Sebree, which started life in 1973 as Anaconda and was briefly owned by oil company Arco, produces about 200,000t per year. It is based in Kentucky, close to the State lines with Indiana and Illinois
Century has plants in Kentucky and Iceland, and part ownership of Mt Holly in South Carolina with Alcoa. It also is working to secure power contracts for its plant in West Virginia, while the second smelter in Iceland is also awaiting power supply.
For me, it is interesting that a Glencore company is acquiring primary aluminium assets. In this case, I understand that Century will be able to bring a better power price to the Sebree plant, which will reduce its exposure to soft metal prices, but the more important long-term implication is for physical premiums. The USA is today net short of primary metal, with imports coming from the Middle East as well as the traditional supply from Quebec.
I bet Glencore’s view is that the premium for long-haul metal from the Middle East is going to be high permanently, and that a domestic producer should be able to position his premium only slightly south of ME premia. Provided not too much money is being lost on the cost of production, owning an asset in a net short situation is a desirable place to be.
Meantime, it also suits RTA’s plan to divest itself of high-cost assets. Witness what RTA has already done with Pacific Aluminium and in Europe with the old Pechiney smelters. New broom Sam Walsh is likely to want to complete the strategy that his predecessor started.
Dick Evans, the CEO of Alcan at the time Rio Tinto bought the Canadian international aluminium company in 2007, issued this message in an interview with me earlier this week.
Dick was responding to some of the talk at the Platts Aluminum Symposium in San Diego this week. Some participants at the Platts conference speculated that Sam Walsh, coming from iron ore, may decide that aluminium no longer fits RT’s profile. “Actually, Sam knows the aluminium industry quite well, having spent some years in charge of RT’s Comalco Aluminium division prior to the takeover of Alcan”. Dick pointed out that the Quebec and British Columbia assets especially represented very good value, despite the lingering soft market conditions. Those smelters have their own energy supply, so they are protected from power price shocks. And they are in an excellent position to sell metal into the USA, which is becoming increasingly short of home-grown production.*
Dick believes that the RTA strategy is pretty well laid out and agreed to. Sam Walsh is likely to move things along. In his time in charge of Rio, Sam is more likely to focus on execution than on developing new strategies.
I put it to Dick that aluminium’s future as a corporate investment strategy is not what it used to be. In 2000, the biggest producers of aluminium in the world were (not in order) Alcoa, Alcan, Pechiney, Norsk Hydro, Rual and Sual and others, all of them being single stream producers. Nowadays, we have the likes of BHP Billiton, Rio Tinto and others who are resources companies. Even Chalco (whose official name is China Aluminium Company) is more interested in copper, coal and rare earths these days. The aluminium guys in these aluminium divisions of conglomerate companies now have to compete with Nickel and other commodities for capital allocations.
But Dick saw it another way. Many years ago, it was the oil companies who were investing in aluminium. Shell, Arco’s Logan County division, and others saw aluminium as a good diversification sector, so the current situation is not all that new. But Dick pointed out that today, we have some pure aluminum plays in Dubal, Alba, Emal, not to mention Rusal, which is a pure upstream aluminum play. So the majority of the metal produced is still being produced by single-stream companies.
Aluminium is suffering from a form of over-supply, but this phenomenon is not a new one. The industry suffered back in the early 1990’s when the Russian metal flooded the market. Dick felt that the market will work its way through the present imbalances in the longer term.
Dick should know about these things. Dick had been with Kaiser almost 30 years until he joined Alcan in 1997, and moved into the Alcan CEO job in 2005. Dick stayed on after the Rio takeover, being in charge of Alcan’s transition to the RT corporate structure and culture.
* Full disclosure - Dick is a shareholder in Rio Tinto. This author is not.
In my previous post, I talked about the relativities between consumer prices and the producer price. I want to add one more thought, relative to the aluminium price for 2013.
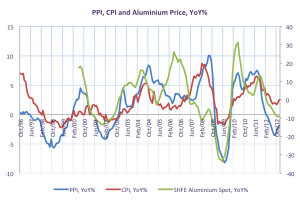
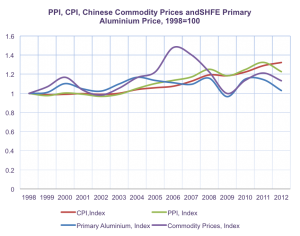
Apart from the sudden, one-off pickup in consumer prices due to a supply side difficulty in this year’s cold winter, the more attention-deserving producer price index has actually been steadily improving. Now, we are seeing a turnaround in producer price index, meaning that fundamental level demand for producer goods are improving. However, aluminium as a commodity has not picked up. This is a very different scenario from 2009 when aluminium prices rebounded before the broad PPI. We believe this is because oversupply has been keeping prices down in the aluminium market, which means if demand increases enough in 2013, we will eventually see a rebound in aluminium price.
The trend can be seen from import prices as well; import prices have been strengthening in recent months and have seemingly bottomed. The story with export prices is less certain, so far, export prices have been weak, indicating weak demand from trading partners. However, a potential strengthening in export prices can be an indicator of better export conditions.
The concept
Relative price can be used to describe the difference between commodity prices, producer prices, consumer prices and wage growths; one can even introduce asset prices in the list to measure not only the strengths of different prices, but to see which part of the economy gets the benefits in times of large scale price swings.
A look at consumer price and producer price
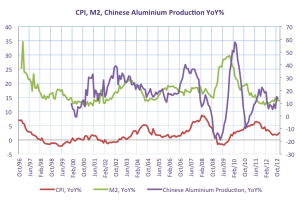
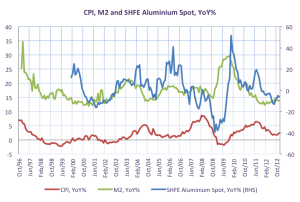
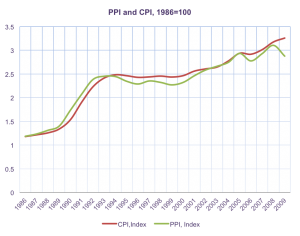
Over the last 15 years, we have seen swings in both consumer prices and producer prices. Between 1988 and 1991, both consumer price and producer price retreated; however, consumer price saw a 2 year contraction while producer price stayed above the zero percent threshold, in year-on-year growth terms. Both price measures returned to grow until another downturn drove prices down in 1993, only to make consumer price contract in 1995 and producer price contract by 1997. Until 1997, consumer price growth stayed well below consumer price growth. There was obviously a serious inflation problem developing in China, particularly in the secondary industry and fixed asset end; the bubble then burst in 1997 with the Asian Financial Crisis. Between 1997 and 2002, producer price growth moved more in sync with consumer price growth, contracting during downturns. The period between 2002 and 2008 saw producer price growth getting ahead of consumer price growth once again, only to be broken in 2009 with the Global Financial Crisis. By 2012, producer price growth on an annual growth basis dropped steeper than consumer price growth.
Who is benefiting?
A number of things can be deduced from the relative price over the last 15 years. The obvious is that producer price has been stronger than consumer price before 1993, then consumer price took over to outperform until now. However, the period between 2002 and 2005 saw producer price catching on and it eventually retreated after that.
By using relative prices, we ask ‘who is benefiting’? Such an angle allows for an analysis on which sectors of the economy actually benefited from these large price swings. Before 1994, the end-markets that represent the consumer price, we may think of them as retailers, were squeezed from high producer prices. Consumer price grew at a slower pace, resulting in the squeeze of end market industries. Between 1994 and 2001, consumer price was strong and producer price was relatively weak, resulting in more margins for industries that were at the end of the supply chain, and less margin for industries that were at the middle of the supply chain. For secondary industries, the pressure of commodity prices was felt particularly strongly between 2000 and 2007; margins were depressed by commodity price hikes. Consumer price was also pushed higher by strong commodity prices and relatively strong producer prices before 2009. Producer price actually outperformed consumer price between 2004 and 2009; now, commodity prices, including the aluminium price, fell off a cliff while producer prices fell below consumer prices again.
The future
What we can say about these changes in the relative prices between commodities, industries that are at the middle of the supply chains and industries that are at the end of the supply chain is that, time is ripe for service sector growth, which will act as another force to encourage real income. Secondary industries are facing excess capacity; their pressure will be relieved somewhat by lower commodity prices. Commodity producers may be faced with a period of low margin, which marks the end of the commodity bull market for now. This makes sense for China as commodity producers inside China are running into serious over-capacity.
0